Better Zendesk Analytics
Better than Explore. A fraction of the price. Built for small teams.
Trusted by 1000+ companies.
Why TicketBoard
Tickets by month
Aug
Sep
Oct
Nov
Dec
Jan
Feb
Mar
247
Total
38
Open
4.2h
Avg reply
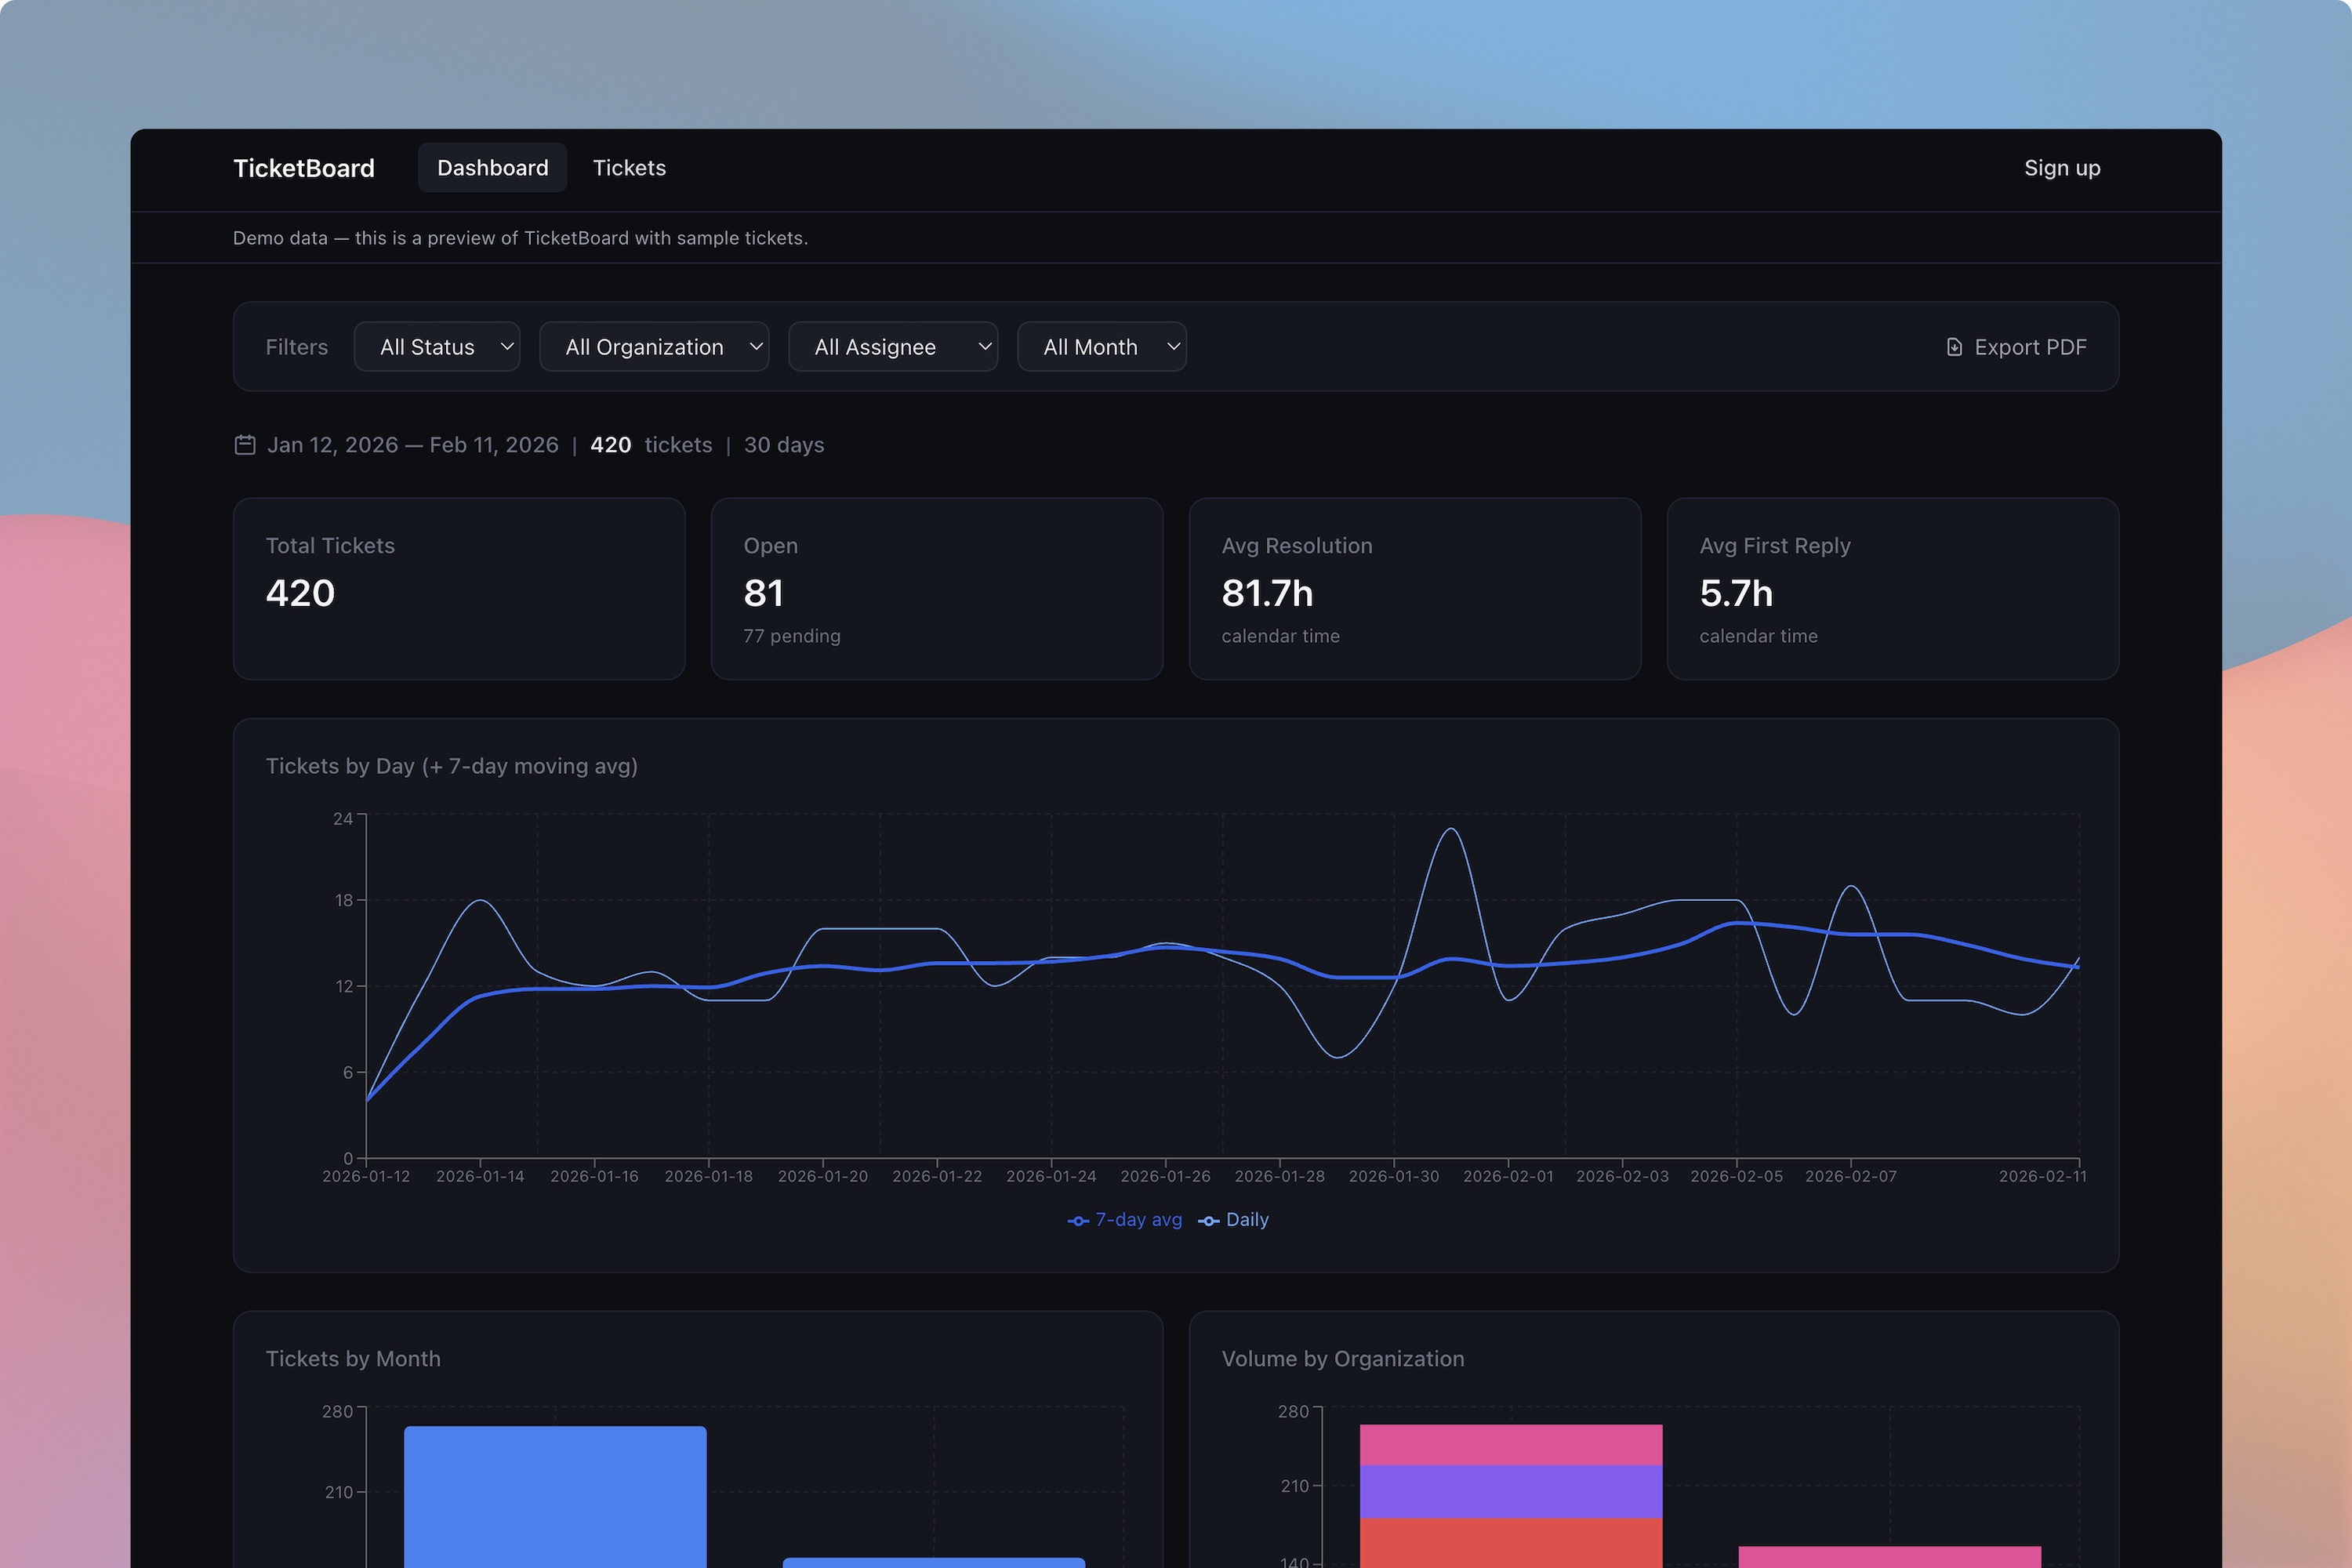
Ticket analytics
Volume trends, resolution times, first reply performance — all in one place.
Tickets by organization
Acme Corp
84
Globex Inc
61
Initech
47
Umbrella Ltd
33
Organization insights
Break down by customer org and spot your highest-touch accounts.
TicketBoard
#support-ops · Mon 9:00 AM
Weekly Recap · Mar 3–9
247
Total
38
Open
209
Solved
Slack weekly recap
Automated digest posted on your schedule — weekly or monthly. Your team sees the numbers without logging in.
Tickets by assignee
Sarah K.
84 · 3.2h avg
Tom R.
61 · 4.8h avg
Alex M.
47 · 5.1h avg
Julia N.
33 · 3.9h avg
Chris L.
22 · 6.2h avg
Agent performance
Volume, reply times, and reopen rates per agent — know who's carrying the load.
Customer satisfaction (CSAT)
87%
satisfaction rate
142 good
21 bad
CSAT tracking
Customer satisfaction score and good vs. bad breakdown, month by month.
Search tickets…
Status ▾
Org ▾
CSV
Subject
Assignee
Org
Status
Open
Solved
Pending
Solved
420 tickets · page 1 of 9
Search & export
Filter by status, org, assignee, or date range. Export everything to CSV.